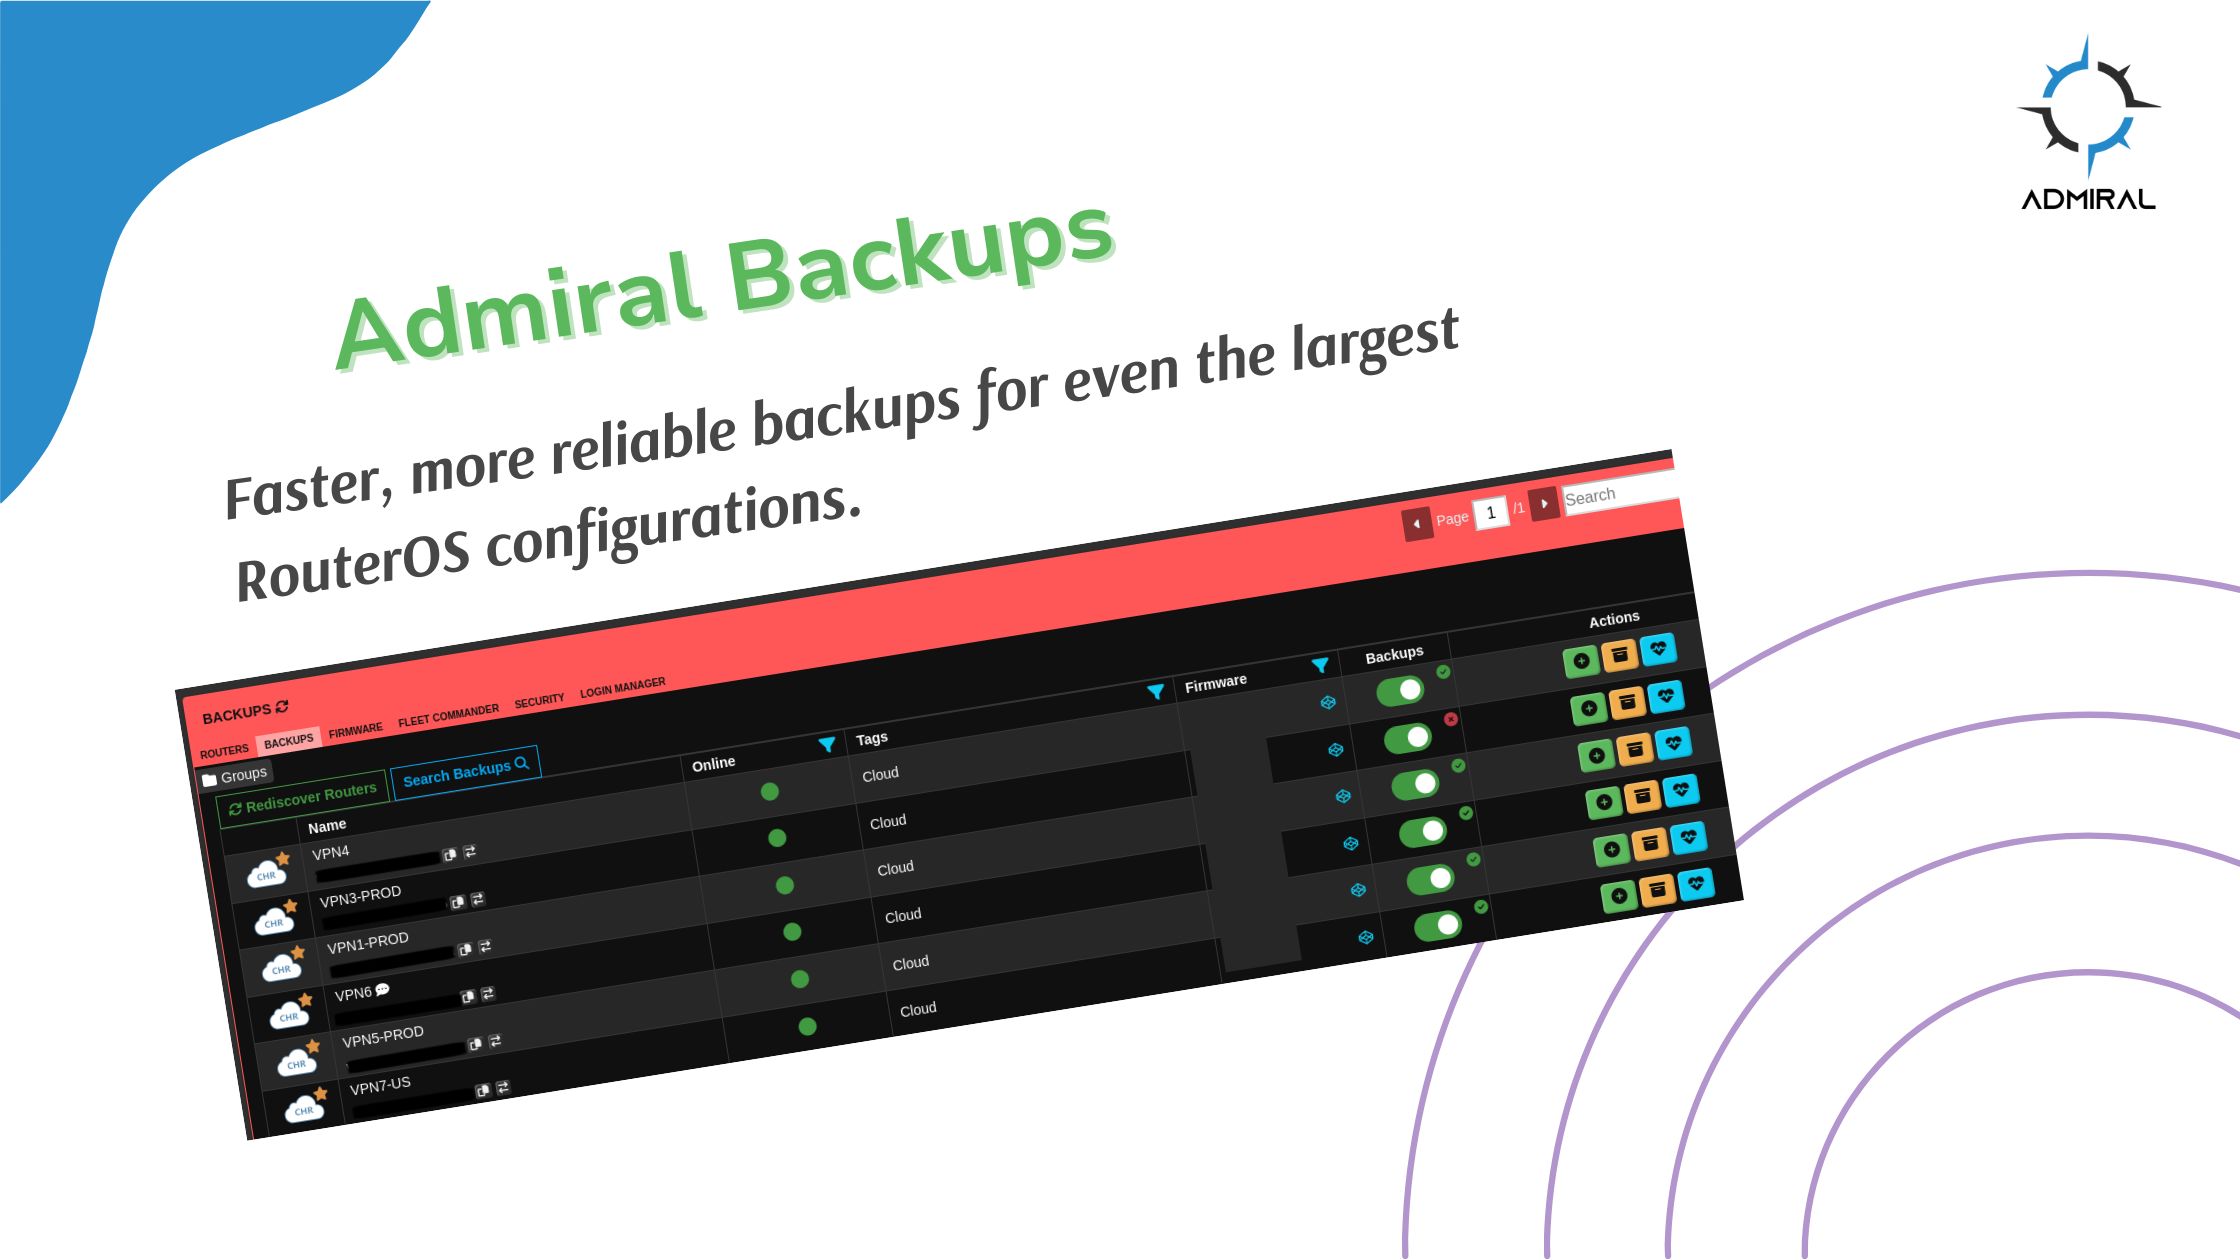
https://youtu.be/N4MYEXsuNp0 We’re excited to officially launch Introduction to Mastering MikroTik — a practical, real-world training built to…

Historical Sensor Data Added!

With all of the crazy weather we’ve been having, the RemoteWinBox team thought we should expand our historical graphs to include sensor information.
We’ve now added fan speeds, temperatures, voltage, and more to our dashboard. So whether you’re having -80F wind chill or +120F heat, RWB is collecting the sensor data from your MikroTik so you can easily visualize your router health from the comfort of your home or office and see the trend info.
You can find this data under your Router Health tab and click “More Info”. The charts will appear with the latest data and provide insight into how the environment is affecting your network.


