Admiral Platform continues to evolve with a focus on making MikroTik and network infrastructure management…
Stop downtime before it starts with Admiral Endpoints monitoring.
How we improved our Linux server monitoring and reduced downtime with Endpoints
The High Cost of Down Time
2022 research from Enterprise Management Associates (EMA) estimated the average at $12,900 for every minute of unplanned IT downtime. Even a brief 10-minute outage can translate into lost revenue and productivity losses, not to mention angry users, and/or brand damage. Keeping ahead of outages requires proactive monitoring, redundancy, and rapid response strategies to mitigate downtime and protect both business continuity and customer trust. Admiral Endpoints is the tool we created to get visibility, monitoring, and alerting before an outage happens.
The Backstory: Learning the Hard Way
We’ll be the first to admit it—our past challenges with preventable outages inspired us to build something better.
Our environment runs hundreds of Proxmox and Ubuntu servers to support tens of thousands of MikroTiks. We couldn’t afford to keep reacting after the fact.
At first we tried libreNMS, but even though the price was right (free), it missed alerting us BEFORE an outage occurred. We needed early warning that a server was in a state of impending doom, not AFTER it was already down and affecting services.
So we kept looking and tried Netdata next, which specifically watches Linux servers for bajillions of stats and health metrics with a per second granularity. At first, it was AWESOME. But, over time we realized that Netdata wasn’t a great fit for us. The heavy agent that collects all those metrics was taking a server that was becoming unhealthy, alerting us about it, and would then go into a death spiral resulting in a server crash with its agent that got stuck in a loop and would finish the server off and kill it, dead before we could react. It was as if it wanted to put the poor server out of its misery as soon as it started feeling bad.
- LibreNMS: The price was right (free), but alerts came after outages, when it was already too late.
- Netdata: Impressive real-time monitoring with “per-second” stats. But the heavy agent would often push struggling servers over the edge, finishing them off before we could intervene.
We realized what we truly needed: lightweight, proactive monitoring that warned us before servers went down.
Introducing Endpoints – See Everything. Fix Anything. Before It Breaks.
That’s when we asked ourselves: What if Admiral could watch our servers, just like it watches MikroTiks?
Endpoints was created to meet our needs and those of our customers.
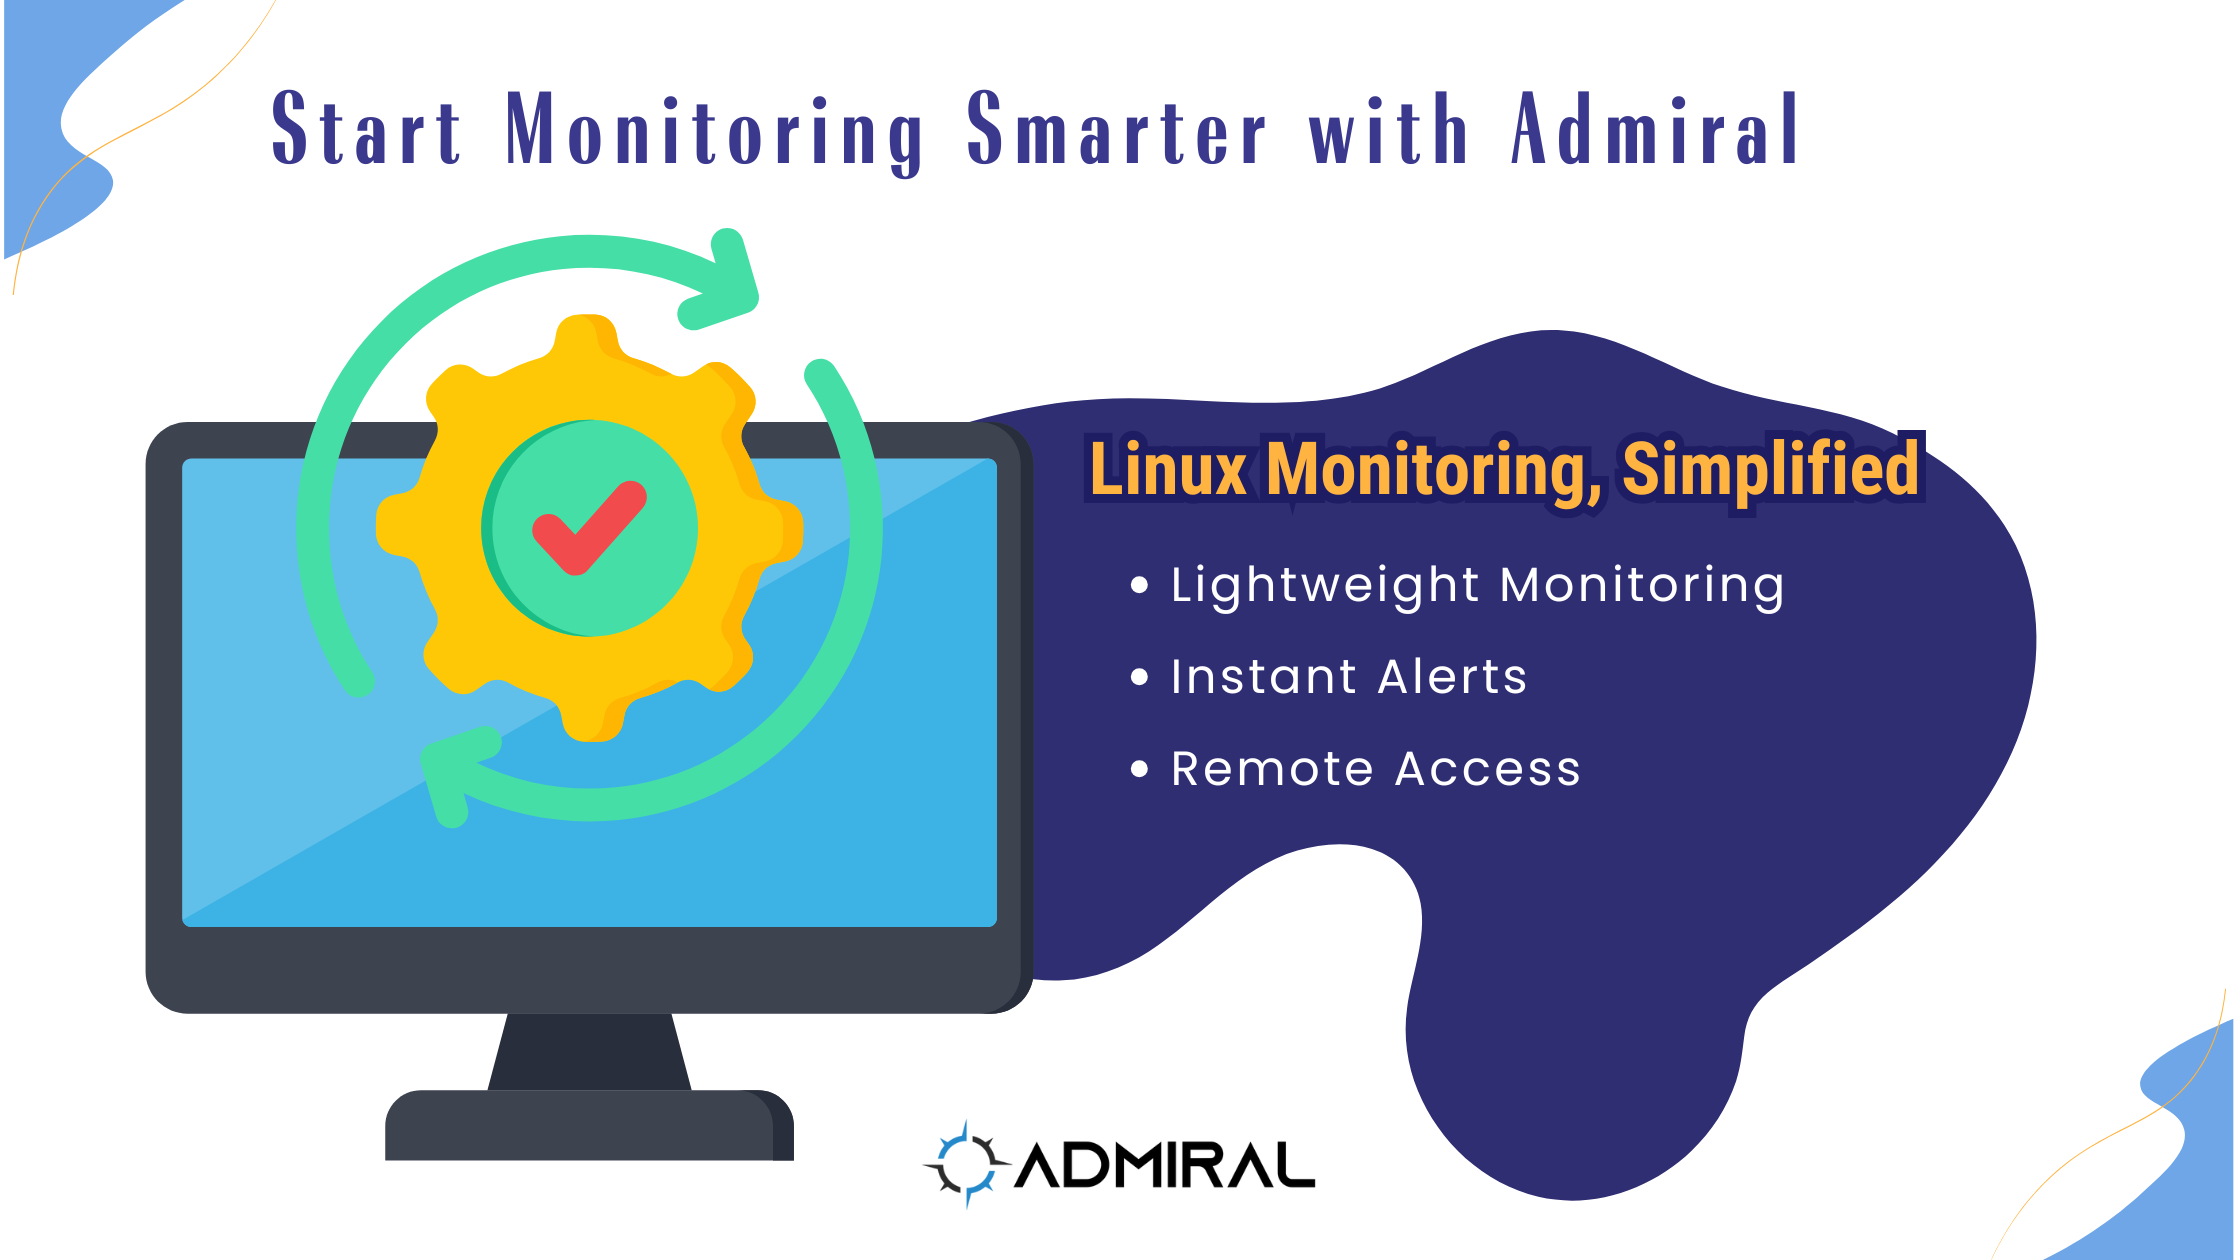
✅ Lightweight monitoring — no heavy agent needed – just a MikroTik!
✅ Early-warning alerts — CPU, RAM, and disk health before failures occur.
✅ Web service checks — monitoring for 200 OKs and error codes.
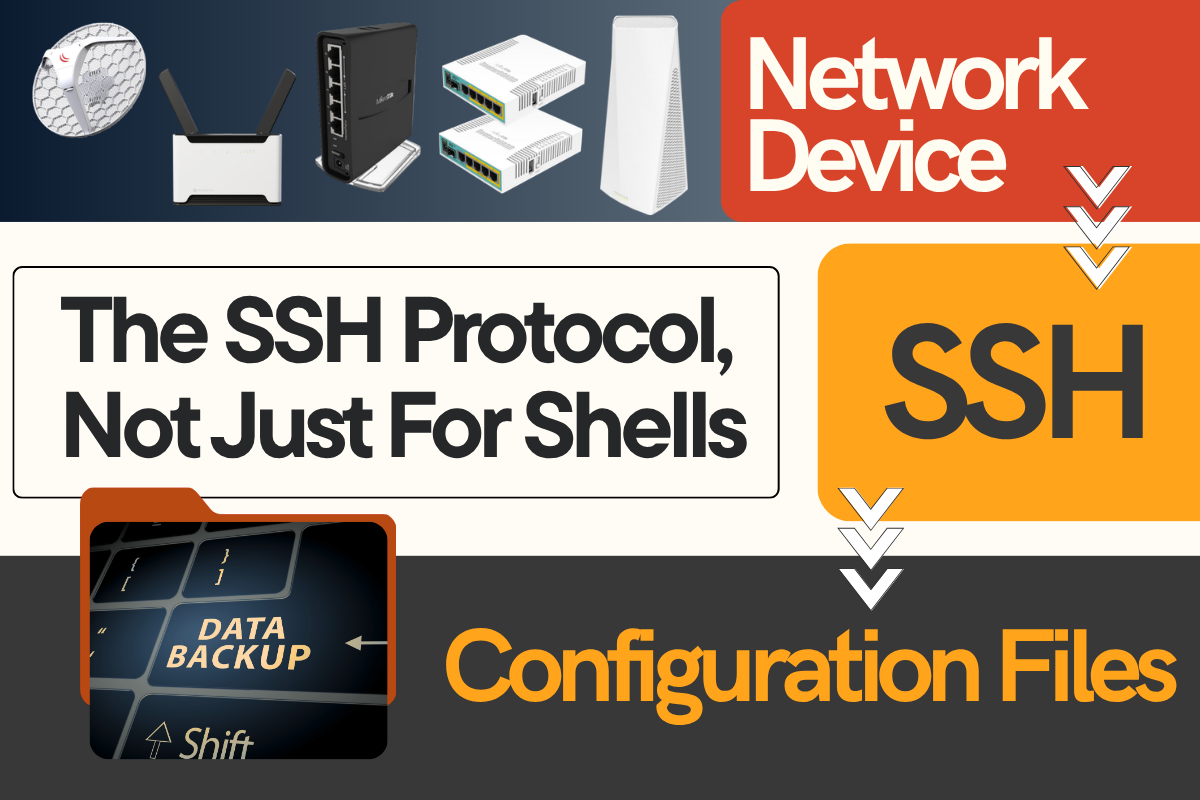
✅ File transfers & remote access — connect to your *nix instance directly from your browser, upload/download files, or launch instant webSSH—just like with your Tiks.
Already, Endpoints has saved us from several outages by catching issues before they became service-impacting. Alerting has notified us when we are running low on disk space. We can take actions to clear logs and update storage if necessary. Watching trends on CPU spikes tells us when we have peak usage on some servers and we can investigate optimization options. A pilot customer is using Endpoints to monitor a specific piece of equipment and requested additional graphs to spot trends that may cause outages. In this case the equipment was a Ubiquity Wave-LR which is a wifi radio that operates at both 60Ghz primary and 5Ghz fail-over simultaneously for redundancy. The additional graphs for capacity and alerting when radio failover occurs identifies when action needs to be taken before impacting customer traffic and generating service calls.
From Zero to Monitoring in 2 Minutes.
As noted above, setting up monitoring can be complex and time consuming. Our goal was to make a RMM easy to use with the infrastructure that Admiral already had in place. So we leveraged our platform for MikroTik and utilizing SNMP to create an easy-to-use UI for adding Linux devices and setting up alerting. The charts and graphs easily give users a heads up on trends for cpu spikes, high disk usage, and more. Adding Linux devices in the Admiral Dashboard requires minimal configuration and can be up and running in 2 minutes.
Multi-Vendor RMM
What’s Next for Monitoring in Admiral?
With Endpoints as the framework, we’re already expanding:
- Ubiquiti Wave-LR support in progress
- Dell PowerEdge & PowerSwitch (with Cisco-style UI) coming soon
- SwOS and other network gear on the roadmap
And we’re not stopping there—database health checks, more integrations, and extended service monitoring are on the way.
Our goal is simple: give operators one platform for visibility, control, and automation across all their infrastructure.
Start Monitoring Smarter with Admiral.
Admiral Endpoints helps your team cut downtime and resolve problems faster.
We built Endpoints because we needed it ourselves. Monitoring and alerting using Endpoints has helped us to decrease frequency and duration of server outages. It has improved our uptime and operations—and we are excited to continue to expand our feature set, protocols and device coverage. Get started with monitoring your Linux devices and ensure your teams can operate at peak efficiency.
🚀 Admiral Endpoints: proactive, lightweight, multi-vendor monitoring and management.
Get Started with Endpoints
Remote Management & Monitoring for *nix is now available in Admiral Platform with a current paid subscription or dedicated deployment. With its simple interface, and powerful visibility, Endpoints gives you peace of mind that your *nix systems and MikroTik network are always running smoothly.
👉 Start monitoring smarter today with Admiral Platform’s Endpoints.
Related Posts