We’ve gotten a lot of questions this week about the FCC announcement and MikroTik’s update…
Level Up Your Network Insights with Admiral’s New Custom Latency Checks
Admiral Platform recently rolled out a feature helps to enhance your monitoring capabilities: the ability to set up additional latency checks across your devices. This means you can ping multiple destinations—near and far—to get a multi-faceted view of your network performance in real time.
What Is It?
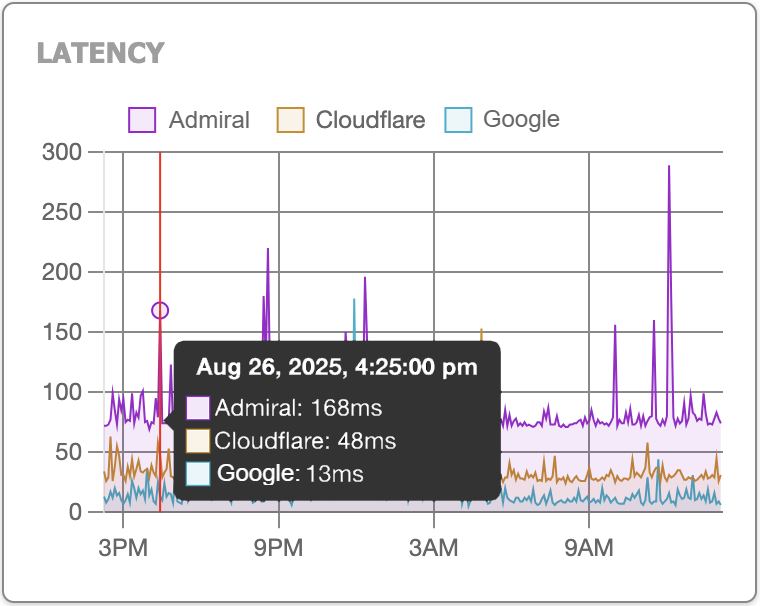
Admiral introduced “Custom ping locations,” allowing users to add up to five extra IP destinations for latency checks during polling cycles. These destinations will appear on the latency graph in the Router Health view, giving you more context and insight than ever before (Admiral Platform – MikroTik Management).
Why It Matters
1. Comparative Latency Across Multiple Points
You’re no longer limited to a single vantage point. Add both local (e.g., ISP gateway) and remote (e.g., external cloud endpoint) destinations. This gives you the power to compare latency trends across different routes and identify anomalies quickly (Admiral Platform – MikroTik Management).
2. Proactive Network Visibility & Troubleshooting
If one destination shows rising latency but another remains unchanged, you might be looking at an upstream issue versus a localized glitch. It’s the kind of insight that saves time, effort, and nerdy detective work.
3. One Dashboard, Smarter Alerts
Everything is seamlessly integrated into Admiral’s Router Health page. No need for separate tools or panels—hit “view” toggles to show or hide each custom destination in the latency graph. Clear, visual, and actionable (Admiral Platform – MikroTik Management).
How to Get Started
Here’s how easy it is to set up:
- Log in to your Admiral Platform account.
- Go to Profile → Latency Checks.
- Enter the IP address of your new destination. Optionally, add a name and description to keep things organized.
- Click Add Destination. Voilà—your ping target is live (Admiral Platform – MikroTik Management).
These checks run approximately every five minutes, so you’ll have near-real-time visibility into latency changes (Admiral Platform – MikroTik Management). To view them, head over to the Router Health page of your device and toggle the views for each destination.
Pro Tips for Using Custom Latency Checks
- Mix proximity: Add one destination inside your network (like your ISP gateway) and one far away (like a cloud server). That way, you can see both local and global performance.
- Name wisely: Use clear labels like “Local ISP” or “Cloud East” to keep your graph uncluttered.
- Iterate over time: Start with two or three, then refine based on where performance issues crop up.
Thanks for being part of the Admiral community. We’re here to help you get more out of your network — with less effort and more peace of mind.
— The Admiral Platform Team ⚓
Related Posts