https://youtu.be/dAq4-usywxU In part two of Episode 4, Tyler Casey of DMTech walks Marc through a…
Tips4Tiks – Packet Capture with MikroTik
2.
Tips4Tiks – Packet Capture with MikroTik
Hey guys, recently we had to use the packet sniffer tool inside of a MikroTik to help us discover what was going on with a new feature we’re working on and we wanted to share with you how you can use this tool to help debug and troubleshoot your network!
What was the problem?
We’re developing a captive portal integration for MDU (Multi-Dwelling-Unit) WiFi where our customers will be able to leave equipment in place as tenants move in and out and they’ll be able to subscribe, pay and manage their own Internet just by joining the WiFi named “UNIT 301” for example. What we found was that despite our redirects working as expected, we weren’t able to display the payment page for our payment processor, Stripe.
So we could see that traffic was getting to the MikroTik and our servers, but we were getting a blank page on the captive portal when attempting to display payment options. Well, what the heck do we do now? I’ll tell you what – We packet capture and inspect what’s happening on the network, of course!
How did we fix it?
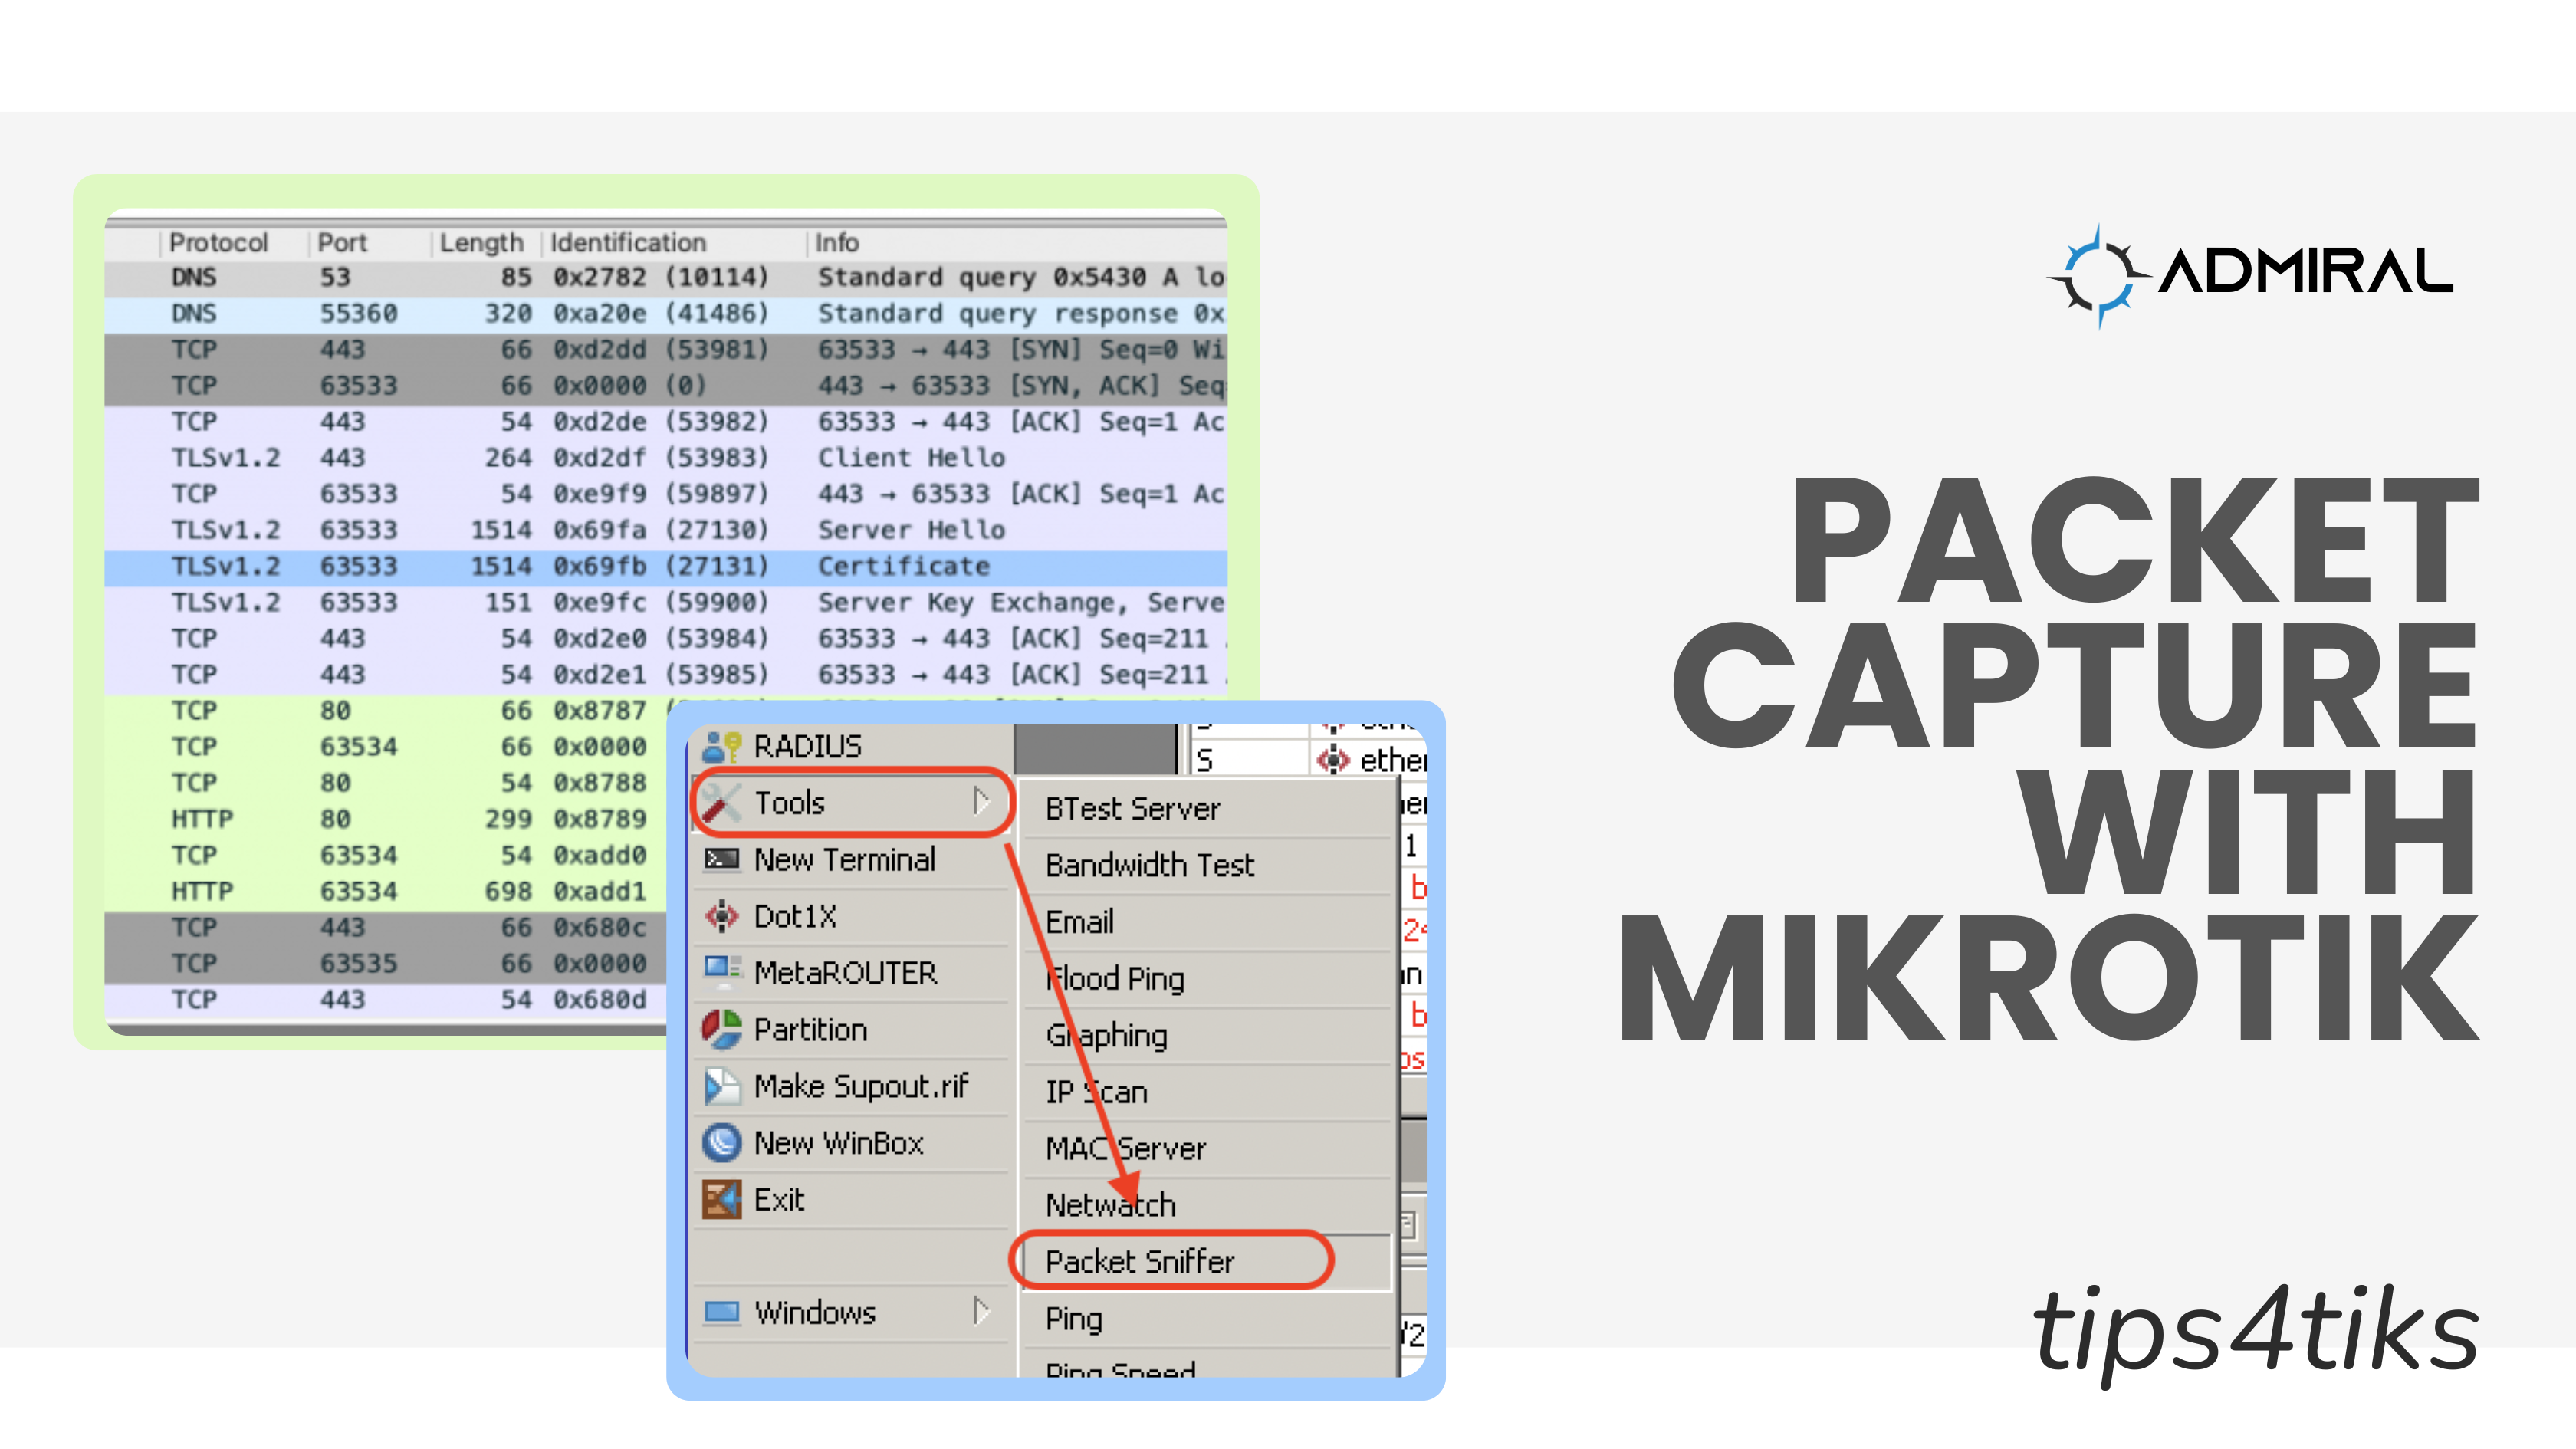
First, log into your MikroTik and head over to TOOLS — PACKET SNIFFER

Next, you have to define the settings of your packet capture. In our case, we were lab testing and didn’t need to filter very much. One thing I really believe in is giving the buffers and file storage a little bit of room, as long as your MikroTik has enough RAM and DISK space to do so (hint: check SYSTEM — RESOURCES if you’re not sure).
I usually bump the RAM memory limit up to 1 MB, set the filename using a .pcap extension, and add some space on the file limit that’s appropriate to what you need to capture and how much storage you have available. Warning: Packet captures can fill up a disk VERY quickly if you have a lot of traffic!
In my case, you’ll see I have 128MB of RAM and 64MB available in SYSTEM — RESOURCES, so 1 MB is not too much to give to packet sniffer and on DISK I have 16 MB total of which 3.7 MB is free, so I set the values like below. Remember, 1000KB is the same as 1 MB.
Finally, I called my PCAP – or Packet CAPture – stripe.pcap so that when I transfer it to my computer I’d know which file to open. If you end up doing a lot of packet captures, I’d suggest using dates in the names too and also the name of the router and/or interface too so that you can tell them apart. Finally, make sure to use the .pcap extension so that your PCAP analyzer will open automatically.

Next up, click on the filter settings and adjust to suit your needs. For example, you can just capture a single PC/printer/router/host by putting in its MAC or IP address, or if you know what type of traffic you’re looking to investigate maybe you only want to look at UDP or ICMP traffic, for example.
In my case, I needed all the traffic for my phone, which happened to have been assigned 192.168.88.252 by looking at IP — DHCP — SERVER — LEASES, and it gets connected to the LAN which on this MikroTik is configured as a bridge called “bridge”, so I set up my capture like this:
Once you’ve set your capture filter the way you want it, hit APPLY to apply those settings from the GENERAL tab and these settings on the FILTER tab and then you can hit START which will begin the packet sniffing process. Hitting Start will generate a new file with the filename specified in your FILES storage.

Packet Sniffing will continue until you hit STOP or the condition on your GENERAL tab is met – which means for us it would run until the file size reaches 1 MB. If you want to see if any packets are being matched and captured, here are 2 ways to know:
1. Click PACKETS on the packet sniffer and see which packets are being matched. What I like about looking at the PACKETS is you can see whether it was transmit (TX) or receive (RX) traffic, source and destination ports, and IPs and packet sizes right off the bat while still in Winbox.

2. Click FILES on the main menu and check out the filename you created (stripe.pcap for me).
- If you are capturing data you’ll see the file size grow and it won’t get bigger in size if you aren’t matching packets with your filter
- Hint: the file will start at 24B which means it just has the boilerplate PCAP headers with 0 packets captured. If it’s bigger than 24 bytes, you’ve captured some packets!

I have a PCAP file, now what?
Now drag that file onto your local PC or right-click on that stripe.pcap and click DOWNLOAD and store it to your PC or laptop.
The next thing we’re going to need is a packet capture analyzer tool. If you don’t already have one downloaded, I recommend WIRESHARK. Wireshark is the world’s most popular network protocol analyzer. Once you’ve downloaded and installed Wireshark, you can double-click on your stripe.pcap file that you downloaded from your MikroTIk, and voila – you’ll be looking at an analysis of your network traffic! Pretty cool if you ask me.

WOW – that’s a LOT! ummmm…
So looking at this screen might be a bit intimidating at first – there’s a LOT going on in here. However, this is showing me all kinds of useful information about what traffic is actually happening on my network, and we’re going to be able to debug and understand what to do to fix our captive portal very quickly.
Knowing that my captive portal was supposed to be displaying Stripe.com information, I figured that what was probably going on was that my device was trying to look up some kind of Stripe related information to display that we were redirected to the captive portal. It’s very common for applications to say, hey start here at something like stripe.com and then pull in a bunch of other locations to show the user some payment forms, graphics, validators and stuff, such as api.stripe.com and payment.stripe.com as examples. Rather than guess away, we decided to look at what DNS queries the device was exactly looking for and then we could adjust the MikroTik firewall policy to allow traffic to those endpoints so that the webpage wouldn’t come up blank.
To do this, at the top of Wireshark there’s a display filter section that looks like a search bar – type in DNS there and hit enter. The search turns green if it’s a valid syntax for filtering (red if it isn’t valid), and now we get the filtered results of just the DNS queries in our PCAP.

Hey, look at that. We don’t need to just allow traffic to stripe.com, we also need to allow traffic to js.stripe.com and lots of other places too, like stripecdn.map.fastly.net and hcaptcha.com.
Next, what we did was go through the whole PCAP and combine that with Stripe’s documentation to find all the domains that we needed to allow through our captive portal configuration in order for payment display and processing to work properly. We then implemented a firewall bypass rule by using a MikroTik address list and added all the domains needed – a whopping 20 different domains!
And because the Stripe documentation didn’t cover all the necessary records, we never would have gotten this information without looking for ourselves!
What do YOU need to PCAP?
I learned how to analyze networks using Wireshark from a trainer named Mike Motta back in the 2000s. There’s a TON more things you can do – from streaming the PCAP out of your MikroTik to a remote collector – to replaying voice conversations – to looking for security flaws and weird behaviors – to understanding and reverse engineering how a piece of software behaves (like what we did above).
Another trick I like to use is to open two PCAPs side by side. On the left, put a PCAP of a capture taken from a working environment and on the right, put the broken environment. Not only will you learn a lot about what’s happening on with those 2 networks, you should also be able to identify what’s different in the packet flows which should be a huge clue to finding the root cause.
Packet capturing is INCREDIBLY powerful, but beware – it is equally incredibly time consuming! Unless you know exactly what you’re looking for, you should expect to spend a fair amount of effort (and time) learning about what traffic on your network(s) is good and what is bad and also what it means.
Regardless of your use case, the MikroTik packet sniffer and the Wireshark network analyzer tool can help you “inspect what you expect” across your network!
Related Posts