If you host services from a home or small office connection, there’s a good chance…
MikroTik LTE monitoring is AMAZING!
7.
MikroTik LTE monitoring is AMAZING!
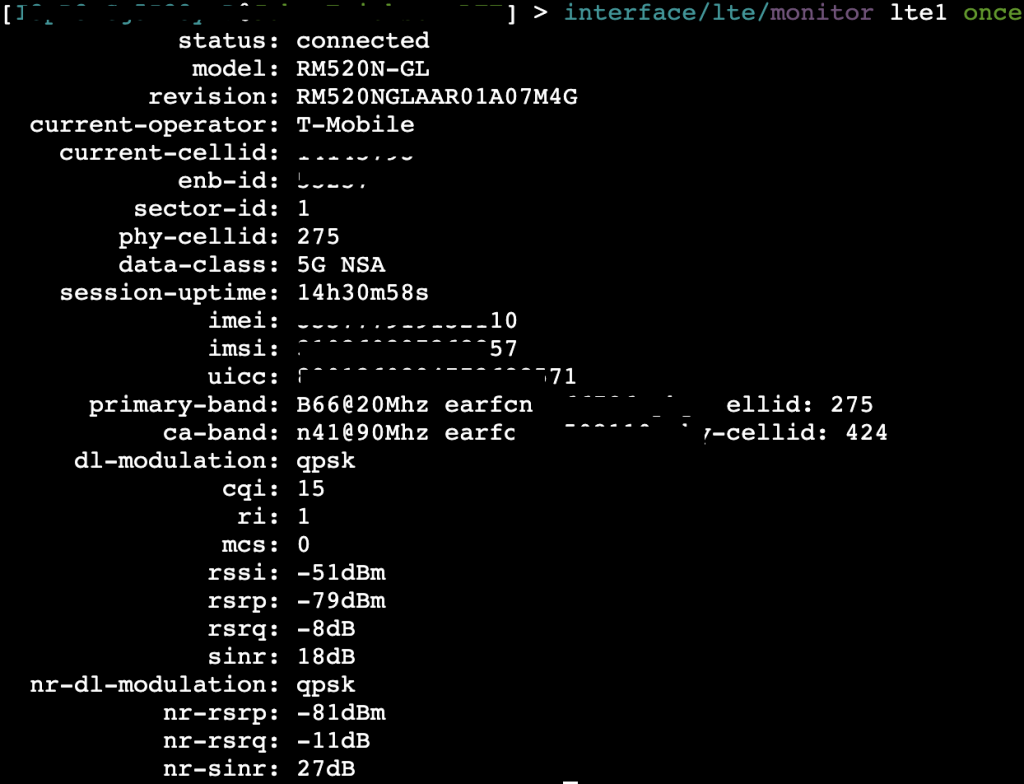
Did you know the /interface/lte/monitor command on MikroTik devices provides real-time, low-level diagnostic data about the LTE modem? This data is incredibly valuable for network engineers and administrators. Here’s an example output and what I think about it from both a technical and practical perspective:
✅ Strengths and Usefulness
- Signal Quality Metrics (RSRP, RSRQ, SINR, RSSI)
These are essential for diagnosing LTE connectivity issues, optimizing antenna placement, and ensuring stable performance. SINR, in particular, gives a great indication of noise and interference levels. - Cell Info (Cell ID, EARFCN, Band)
Useful for identifying which cell tower you’re connected to and what frequency band is in use—key for troubleshooting poor performance or doing coverage planning. - Operator Info (current operator, access technology)
Helpful for determining if the modem is on LTE vs 3G and what operator the SIM is currently registered to. Crucial for multi-operator environments or failover scenarios. - Real-Time Update Mode
This command runs interactively and updates every few seconds, making it great for live debugging or alignment when physically adjusting antennas.
So I see a bunch of numbers, what’s it all mean?
1. RSRP (Reference Signal Received Power)
- Definition:
RSRP is the average power level of reference signals (pilot signals) transmitted by the LTE cell (eNodeB) over the physical downlink shared channel (PDSCH). - Measurement Range:
Typically between -140 dBm to -44 dBm. - Indicates:
- Signal strength from a specific LTE cell.
- Used by UEs (User Equipment) to determine which cell to connect to (cell selection, handover, etc.).
- Lower (more negative) values indicate weaker signals.
- Example Interpretation:
| RSRP (dBm) Signal Strength | Rating |
| >-80 | Excellent |
| -80 to-90 | Good |
| -90 to -100 | Fair |
| <-100 | Poor |
2. RSRQ (Reference Signal Received Quality)
- Definition:
RSRQ = (N × RSRP) / RSSI, where N is the number of resource blocks used for the measurement. - Measurement Range:
Usually from -19.5 dB to -3 dB. - Indicates:
- Quality of the signal.
- Takes into account both signal strength and interference/noise.
- Useful in congested environments.
- Example Interpretation: RSRQ (dB)Signal Quality
- > -10 = Good
- -10 to -15 = Fair
- < -15 = Poor
3. SINR (Signal to Interference plus Noise Ratio)
- Definition:
The ratio of the desired signal power to the sum of interference and noise power. - Measurement Range:
Typically from -10 dB to +30 dB. - Indicates:
- Clarity of the signal.
- Higher SINR means better throughput and more reliable data transfer.
- Crucial for determining modulation and coding schemes.
- Example Interpretation: SINR (dB)Link Quality
- > 20 = Excellent
- 13 to 20 = Good
- 5 to 13 = Fair
- < 5. = Poor
4. RSSI (Received Signal Strength Indicator)
- Definition:
The total received wideband power including all interference and noise over the entire bandwidth. - Includes:
- Serving cell signals
- Interference from neighboring cells
- Background noise
- Measurement Range:
Varies, often -120 dBm to -30 dBm. - Indicates:
- Overall signal energy in the channel.
- Not directly used for handover or reselection (that’s RSRP/RSRQ).
- Note:
RSSI is used in calculating RSRQ.
5. EARFCN (E-UTRA Absolute Radio Frequency Channel Number)
- Definition:
A numeric identifier that represents a specific LTE carrier frequency. - Used For:
- Determining the center frequency of an LTE channel.
- Helps devices tune to the correct frequency band.
- Example:
- EARFCN 6300 corresponds to Band 3, frequency ~1805 MHz (DL).
- Each LTE band has a specific EARFCN range.
- Formula (Downlink): iniCopyEdit
F_DL = F_DL_low + 0.1 × (EARFCN - N_OFFs-DL)Where:F_DL= Downlink frequency in MHzF_DL_low= lowest frequency of the bandN_OFFs-DL= offset for the band
Summary Table of the numbers that matter
| Metric | Measures | Unit | Indicates | Typical Range |
|---|---|---|---|---|
| RSRP | Reference signal power | dBm | Signal strength | -140 to -44 |
| RSRQ | Signal quality (RSRP/RSSI) | dB | Signal quality | -19.5 to -3 |
| SINR | Signal to noise ratio | dB | Link clarity | -10 to +30 |
| RSSI | Total received power | dBm | Overall energy | -120 to -30 |
| EARFCN | Channel frequency | Number | Channel tuning | Band-specific |
⚠️ Limitations and Gotchas of LTE monitoring
- Not Persisted or Historical
Data is not logged unless you manually capture it. So it’s great for live checks, but not useful for trend analysis unless paired with something like Admiral Centralized MikroTik Management. - 1 by 1
It’s a huge pain and very time consuming to login to each of your MikroTiks to check on the LTE monitoring.
💡 How to Get More Out of It
First, check out the official documentation on MikroTik’s own wiki here.
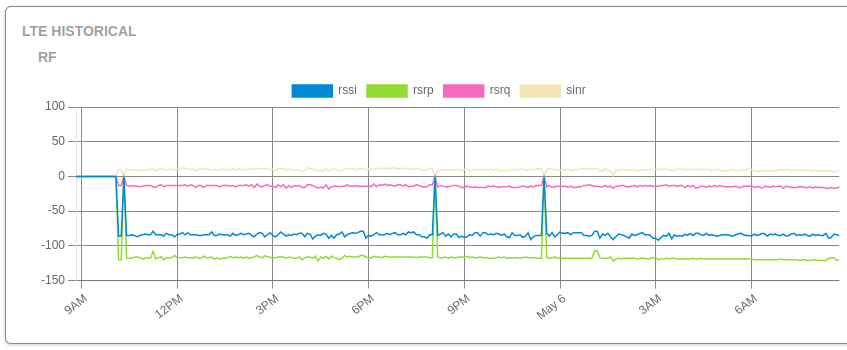
Use Admiral! One of our customers recently announced, “Having this LTE history graph is invaluable!”
Did you know that Admiral automatically tracks historical charts and data for LTE stats? It’s true – and it’s powerfully useful.
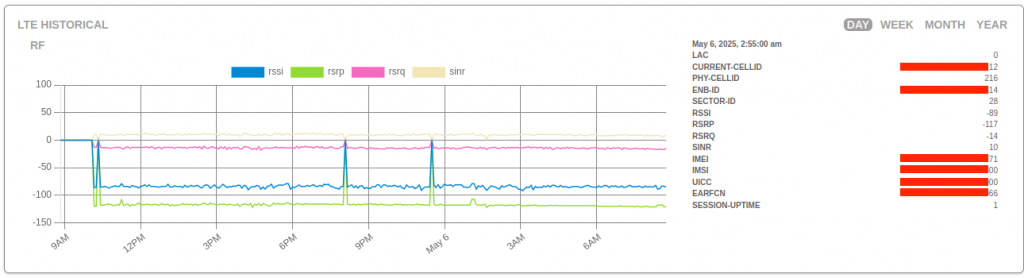
What does Admiral track?
We keep track and graph all the data points that the MikroTik LTE modem provides, so if you see it in the GUI or CLI, Admiral will track it too! You can even download a CSV of the current information provided by your MikroTik for review of the raw text data you see here anytime!
Without Admiral, you’d have to track this information one by one and in real-time. But with Admiral, we automatically grab all this data for all of your LTE MikroTiks all day, every day so that you can see both how things look now and over time! And it works on any LTE, even behind NAT/private IP – we can even proactively send you alerts when the MikroTik needs your attention.
If you’re operating LTE MikroTiks, use Admiral!
Related Posts