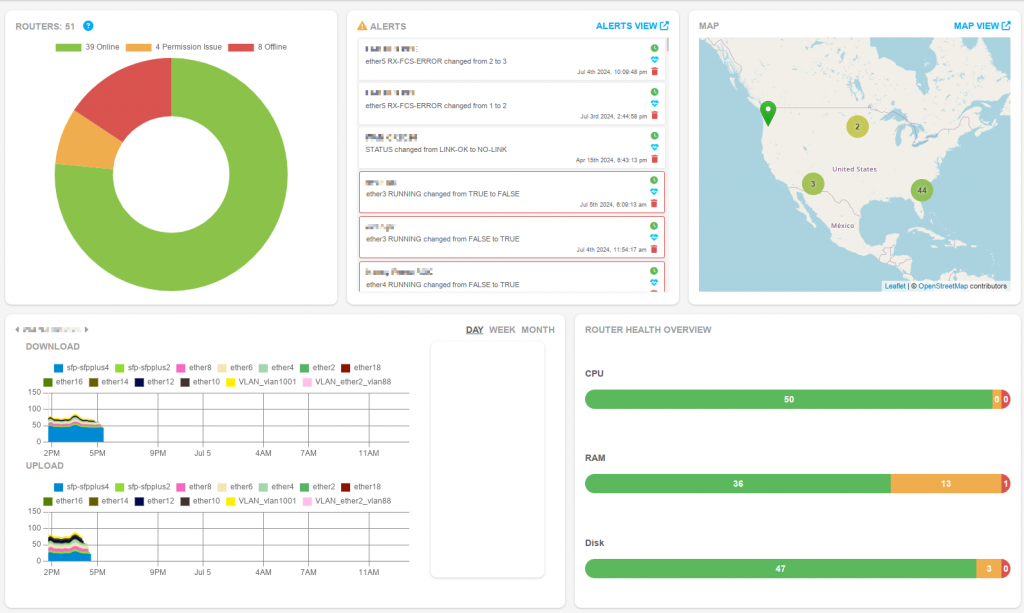
The Dashboard is a heads-up-view of all of your connected devices and their status of Online or Offline. The system will take about one minute to update your device status once it’s connected to the Internet.

Status Ring #
The status ring provides a count of all routers, and divides them into online, offline, and those with permissions issues. Click on the colored box to hide those routers from the graph. Clicking on the colored portion of the ring graph takes you to a filtered view of your router list.
Alerts #
Alerts for your routers and dashboard will appear in this box. This box automatically updates every minute. Use the 3 buttons on the right side of the alert to view the router’s timeline, router health page, or dismiss the notification. Click on the link in the top right corner to view the Alerts Page.
Map #
The map is automatically generated using the address or Lat/Long data that you give to your routers. Click on a circle to zoom in on the region its routers are in, or click on a pin to display the router name. Go to Router Health > Edit to add or change address data. Click on the link in the top right corner to view the large map.
Favorites #
This box automatically cycles through bandwidth graphs of routers you have set as “favorites”, moving to the next favorite every minute. Mouse over the graph for precise data. Go to Router Health > Edit to set up to 10 routers as favorites.
Router Health Overview #
Quick data for CPU, RAM, and DISK percentages for your deployment. Mouse over for more data.
Alerts View #
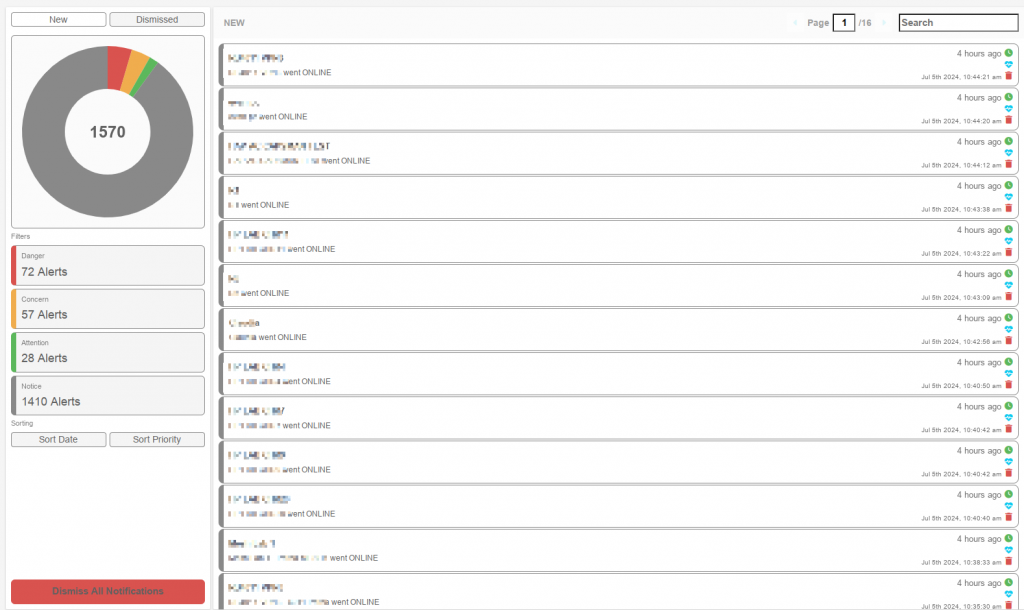
Click the icon above the alerts panel for an advanced alerts view that refreshes every minute. Use the filters on the left side to pare down alert types. Use the search box in the top right to search for specific keywords. The Dismissed button in the top left will show previously dismissed alerts. Use the 3 buttons on the right side of the alert to view the router’s timeline, router health page, or dismiss the notification.

Large Map View #
Click the icon above the map for an interactive map view that updates every minute, displaying online/offline notifications in the right panel. Adjust Marker Size in the top left corner. Click on a marker to view the router’s name, and then click on the blue button to navigate to it’s Router Health page.

Dashboard NOC VIew #
The Dashboard, Alerts Page, and Large Map all update automatically every minute. They make great tools to leave up on monitors in your NOC,to keep an eye on your network. To prevent session issues, you may want to create an additional dashboard user so you can sign in with your user on a different machine if needed.
Having trouble? Contact us at support@admiralplatform.com
Learn more about managing your MikroTiks at https://admiralplatform.com


